Bitcoin failed to hold $70,000. The selling pressure that followed was swift, and the support being tested now is not comfortable. And in that exact moment of weakness, one of the oldest narratives in macro investing has quietly re-entered the conversation.
A report from top analyst Darkfost has identified a developing divergence between gold and Bitcoin that markets are beginning to price. Gold, after an exceptional run that made it one of the strongest performing assets of the past year, has entered a clear correction — breaking below its 180-day moving average in a decline driven partly by margin calls and forced liquidations rather than any fundamental reassessment. The smart money that was long gold is not exiting by choice. It is being forced out.
On the other side of that trade, Bitcoin is consolidating. The price is under pressure, the $70,000 level has not held, and BTC remains below its own 180-day moving average — currently estimated at $89,700 — by a significant margin.
That gap is the problem. The capital rotation narrative requires BTC to be above its 180-day MA while gold sits below its own. One condition is met. The other is not. The trade is being discussed. It has not yet begun.
The Rotation Signal Has a Definition. Right Now, It Is Flashing Red
Darkfost’s framework is deliberately simple, and that simplicity is its strength. Two assets, two moving averages, one binary read: when BTC trades above its 180-day MA while gold trades below its own, the signal is positive — capital is diverging in Bitcoin’s favor. When both assets trade below their respective 180-day averages simultaneously, the signal is negative. No composite index, no weighted formula, no room for interpretation.

By that measure, the current reading is unambiguous. Gold has broken below its 180-day MA. Bitcoin remains below its own at $89,700. Both assets are on the wrong side of their long-term trend lines at the same time, which is the definition of a negative signal. The rotation narrative is circulating. The rotation data is not yet supporting it.
Darkfost is precise about what this framework can and cannot claim. It captures trend divergence. It does not confirm capital movement. The assumption that money leaving gold-related positions is being redirected into BTC is an extrapolation — a reasonable one given historical precedent, but an extrapolation nonetheless. Correlation between gold’s correction and Bitcoin’s stabilization is visible. Causation requires more than a chart.
The signal will turn positive the moment Bitcoin reclaims $89,700, with gold still below its own average. Until that crossing occurs, the rotation trade remains a thesis in search of its trigger.
The Ratio Chart Shows Bitcoin Losing the Argument Against Gold
The Bitcoin-to-Gold ratio is trading at 15.07, down 4.02% on the week — a candle that opened at 15.12, reached 16.55, and has since collapsed to a session low of 15.01. That weekly high rejection at 16.55, followed by a near-full retracement to the open, is not consolidation. It is Bitcoin surrendering ground to gold in real time.
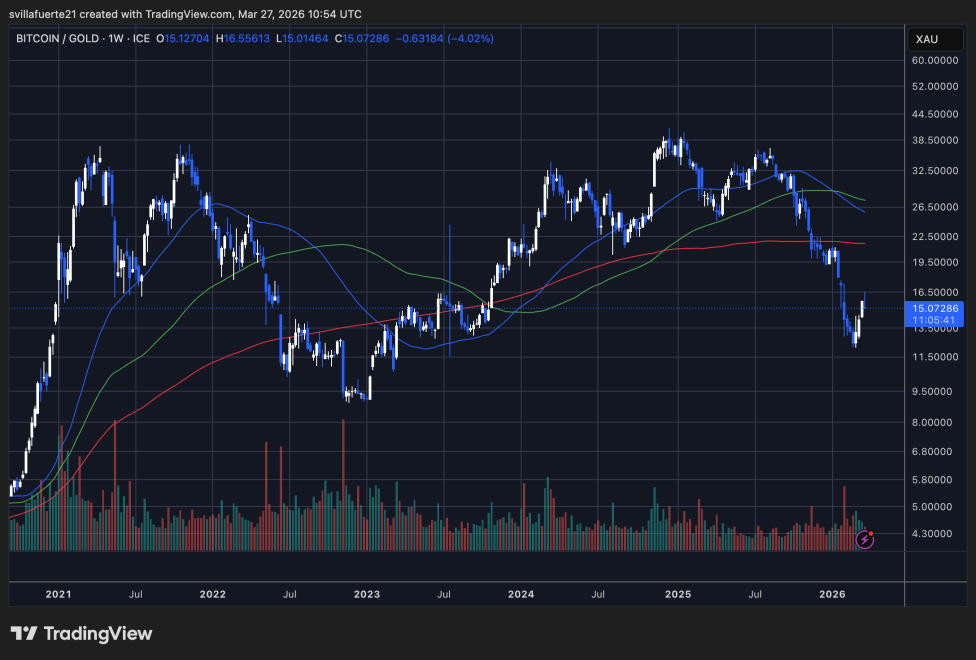
The macro picture is what gives the current level its full weight. The ratio peaked near 40 in late 2024 — meaning one Bitcoin bought 40 ounces of gold at the cycle high. It now buys approximately 15. That is a 62% collapse in Bitcoin’s purchasing power relative to gold over roughly fifteen months, erasing the entirety of the 2024-2025 outperformance and returning the ratio to levels last seen in early 2023.
The weekly moving average structure confirms the severity of the deterioration. The ratio has broken below all three MAs — the 50-week, 100-week, and 200-week — with the 50-week crossing below the 100-week in a death cross configuration. All three are now sloping downward in sequence. Price is currently testing the 200-week MA near the 14-15 region — the last structural support this chart offers before the 2023 lows near 9 come into view.
This chart does not support the rotation narrative. It quantifies how far Bitcoin has fallen relative to gold and how much ground it needs to recover before the ratio argument changes.
Featured image from ChatGPT, chart from TradingView.com
from Bitcoinist.com https://ift.tt/aM0gh8b
Comments
Post a Comment