
Bitcoin Now Less Volatile Than Tesla, Nvidia — Schwab Data

Morgan Stanley is inching closer to launching the first spot Bitcoin ETF issued by a major US bank, a move that underscores just how far the cryptocurrency has traveled from its wild early days.

The bank recently received an official NYSE listing notice for its fund, MSBT — a step that analysts say typically signals a debut is near.

Wall Street’s Deepening Embrace

That development arrives alongside fresh data from Charles Schwab showing Bitcoin’s price swings have dropped sharply over the past four years.

According to the firm’s analysis, Bitcoin’s historical volatility hit 42% in 2025 — roughly half what it recorded in 2021. For context, Tesla’s historical volatility came in at 63% that same year.
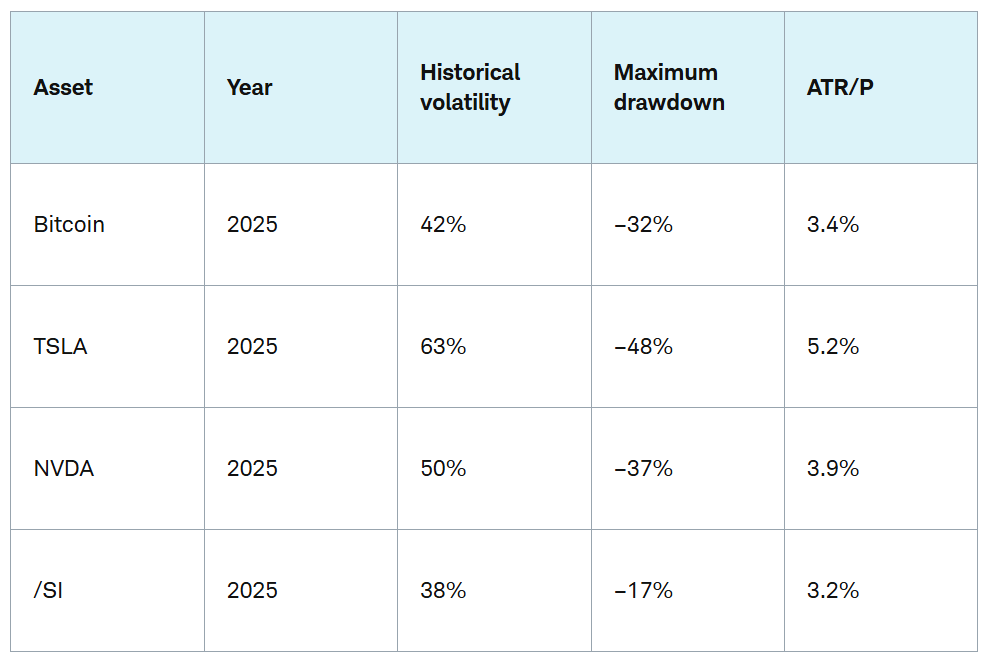
Nvidia’s was 50%. Both exceeded Bitcoin’s. Measures of daily price movement told a similar story, with Bitcoin tracking closer to major equities than the volatile fringe asset it once resembled.

Schwab concluded the shift reflects Bitcoin’s deeper integration into mainstream finance, now trading on major exchanges worldwide through regulated products and ETF wrappers. The report described Bitcoin’s volatility as having “calmed down” as it matured.
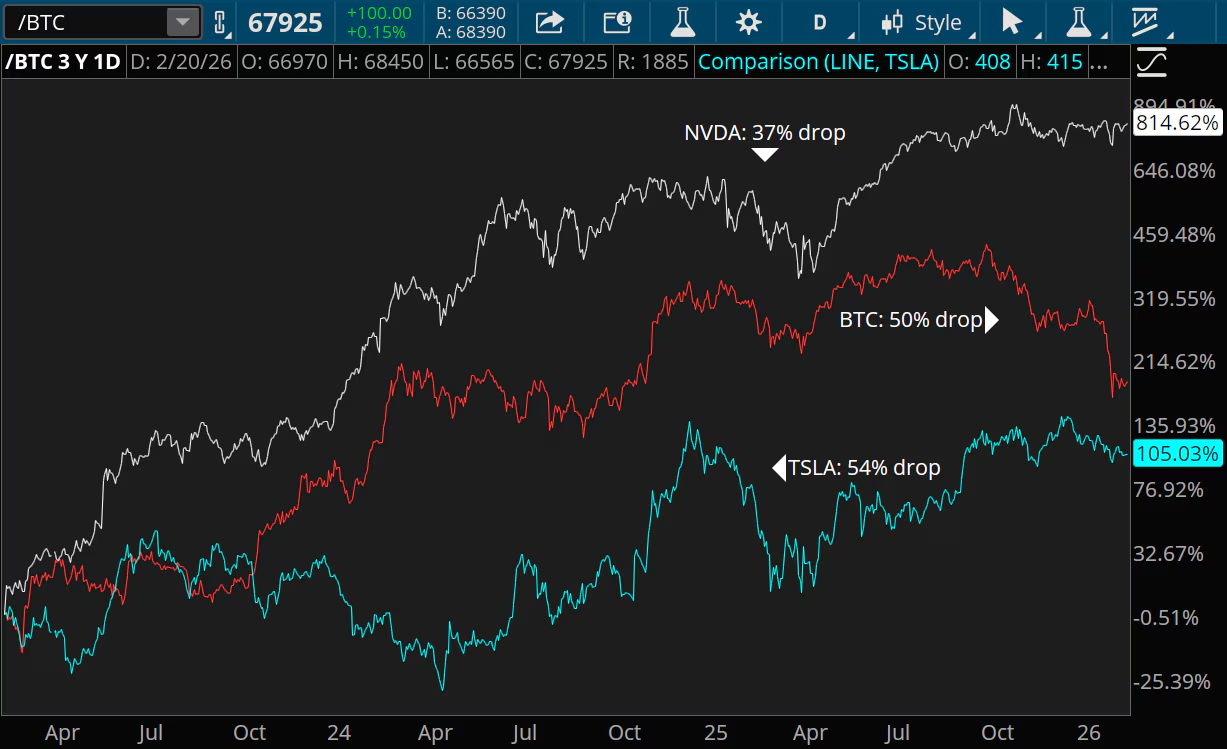
Still, calm is relative. Bitcoin dropped as much as 30% in 2025, with losses carrying into early 2026. Over a three-year stretch, the asset fell 50% from peak to trough.

Those numbers are significant by almost any measure — but not unique. Tesla’s worst drawdown over the same period hit 54%. Nvidia fell 37% at its low point. The data suggests high-growth technology stocks can swing just as hard, or harder, than Bitcoin on a bad run.

The Long View Tells A Different Story

Zoom out further and Bitcoin’s profile grows more extreme. During the 2022 market downturn, Bitcoin fell 77% from its peak. Tesla dropped 74%. Nvidia lost 66%. The losses were steep across the board, but Bitcoin’s were steeper.

Schwab also put Bitcoin up against commodities. Silver futures often moved more erratically on a day-to-day basis, despite recording smaller overall declines.

Gold, by contrast, posted steadier gains at lower volatility — a clear reminder that Bitcoin, whatever its trajectory, still operates in a different risk class from traditional safe-haven assets.

Within crypto markets, Bitcoin’s relative stability has grown more noticeable. Ethereum continues to trade with higher volatility and deeper drawdowns, and the gap between the two assets has widened since 2021.

A Benchmark Shift In The Making

The Schwab report lands as Bitcoin increasingly gets measured against blue-chip equities rather than speculative assets. Whether that framing sticks may depend on how the asset behaves through the next major market stress test — a question the data cannot yet answer.

Featured image from Unsplash, chart from TradingView


from Bitcoinist.com https://ift.tt/HfhStgY

Comments

Popular posts from this blog

Ethereum On Exchanges Crashes To Historic Low Amid Market Volatility, A Bullish Signal For Price?

Ethereum saw a bounce back above the $3,000 price market , with bullish sentiment gaining momentum among investors, especially those on centralized exchanges. Even with the market experiencing sideways movements, the overall supply of ETH on crypto exchanges has fallen sharply, hitting unprecedented levels. Lowest Supply Of Ethereum On Exchanges Recent signals from on-chain metrics indicate that the Ethereum market environment is undergoing a quiet yet significant transformation. This unfolding trend is due to the sharp drop in the supply of ETH available on cryptocurrency exchanges. Related Reading: Ethereum Network Fatigue? Monthly On-Chain Transactions Drops As Activity Slows Down As reported by Coin Bureau on the social media platform X, ETH supply on centralized exchanges has hit levels not seen in years. With more holders choosing long-term storage, staking, and self-custody over keeping their assets available for trade, this significant supply drain indicates a change in i...

Bitcoin Remains Range-Bound As Volatility Declines – Analyst Explains Price Action

Bitcoin has experienced frustrating price action in recent weeks, leaving investors impatient about its short-term direction. The price has been testing crucial supply levels between $98K and $100K, struggling to break out as uncertainty dominates the market. The lack of a clear move has led to speculation about whether BTC is preparing for a breakout or another correction. Adding to the uncertainty, the market was hit by negative news on Friday when crypto exchange Bybit was hacked, resulting in the theft of $1.4 billion in ETH. The incident caused fear and volatility, briefly dragging prices lower. However, Bybit responded quickly to reassure investors, easing some of the initial panic and stabilizing the market. Despite this, Bitcoin continues to consolidate in a tight range. Crypto expert Daan shared an analysis on X, noting that BTC is still ranging while volatility is steadily decreasing. As price compression increases, traders are on high alert for a potential explosive move....

Past Performances Say Dogecoin Price Could Blast 200% To Clear $0.73 ATH Soon

The Dogecoin price could be getting ready for a fresh bullish wave as a crypto analyst projects a surge to new all-time highs . The analyst cites past performances as a reason for this bullish projection, highlighting the Dogecoin price action from previous bull cycles.  Dogecoin Price Past Performance To Push It Above $0.73 Crypto analyst Javon Marks took to X (formerly Twitter) on February 22 to share a bullish prediction of the Dogecoin price. The analyst highlighted past bull market performances to support his forecast, predicting that DOGE could soon rally above its current all-time high of $0.73905. In his chart, Marks revealed Dogecoin’s price action during the 2016/2017 bull run and the 2020/2021 bull market. In both cycles, DOGE seemingly experienced a rapid price crash, following a descending price channel . However, after a long period of consolidation, it recorded a massive price rally that triggered an ATH breakout to $0.00232 in 2018. During the 2021 bull marke...