Bitcoin is testing $67,000. Days of attempting to push above $71,000 have produced nothing conclusive. And yet, beneath the price action, the miners are sending a signal that has historically mattered more than the short-term chart.
An XWIN Research Japan report tracking miner behavior has identified a sharp decline in selling pressure from the mining cohort — the clearest on-chain supply signal of recent weeks. Miners, who represent the market’s most consistent and structurally significant source of fresh Bitcoin supply, have largely stopped selling.
That kind of withdrawal from the sell side does not happen by choice. It happens when forced selling has run its course — when the weakest hands have already capitulated, and what remains is a mining industry that has either hedged, held, or shut down unprofitable operations entirely.

Historically, that condition has a name: late-stage capitulation. And late-stage capitulation has a tendency to precede bottom formation.
The report is careful not to overclaim, and the caution is warranted. Demand remains weak. Supply improving while demand stagnates is a necessary condition for recovery — not a sufficient one. The floor may be forming. The buyers needed to build on top of it have not yet arrived.
The Mining Industry Is Consolidating Under Maximum Stress
The report adds a dimension that the price chart cannot show. Hash rate — the total computational power directed at the Bitcoin network — continues to rise even as mining profitability collapses. Hash price is approaching historic lows. The average cost of production has climbed to approximately $80,000, a level that leaves a meaningful portion of the network operating at a direct loss on every block mined.

That divergence between rising hash rate and deteriorating economics has one explanation: the miners still running are not the ones who should be running on profitability alone. The weaker, less capitalized operations have been forced out or are in the process of being forced out.
What remains is a consolidated industry dominated by large players who have either secured cheap energy, access to capital markets, or a second revenue stream — increasingly, the latter means AI and high-performance computing infrastructure. Mining rigs are being repurposed. Business models are being rewritten.
The structural consequence for Bitcoin supply is direct and durable. A consolidated mining industry sells less, holds more, and responds to price recovery differently than a fragmented one. In the short term, reduced selling pressure supports stabilization. Over the medium term, the supply side of this market has been permanently restructured by the stress that is currently breaking it apart.
The pain is real. So is what it is building.
The Bitcoin Chart Is Not Cooperating
Bitcoin is trading at $67,688, down 1.65% on the day. The session opened at $68,820, reached $69,179, and has sold off consistently since — a candle that rejected the $69,000 level within hours of testing it and has found no meaningful bid on the way down. The attempted push above $71,000 earlier this week has been fully retraced. The chart remembers every failed breakout.
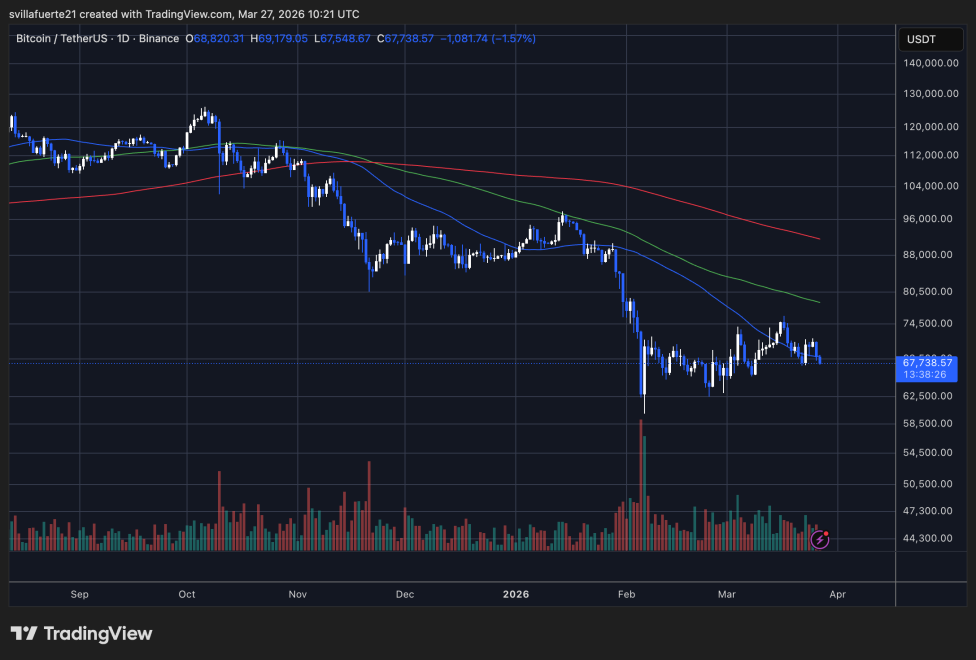
The daily moving average configuration offers no relief. All three MAs are declining in sequence, and the price is trading beneath all of them. The 50-day MA has crossed below the 100-day MA — a death cross confirmed on the intermediate timeframe — with both accelerating lower toward the $80,000–$88,000 region. The 200-day MA, descending from approximately $96,000–$104,000, remains so far above the current price that it functions as a reminder of structural damage rather than actionable resistance.
The February capitulation wick to $59,000 — the highest-volume candle on the entire chart — established the most significant support test of this drawdown. Price recovered from it. The recovery has since stalled, ranged, and is now pressing back toward the lower boundary of that range.
$67,500 is the immediate floor. Below it, $63,000, and ultimately the February low at $59,000 are the next structural references. The on-chain supply signal is constructive. The price has not confirmed it.
Featured image from ChatGPT, chart from TradingView.com
from Bitcoinist.com https://ift.tt/7mlXhco
Comments
Post a Comment