
Is Bitcoin Price Going To $30,000? Bearish Indicator Suggests Possible 70% Decline

The Bitcoin price had another rollercoaster performance in the past week, surging to over $113,000 by mid-week before crashing back down to around $107,000. While the premier cryptocurrency’s price action has steadied in the past few days, market uncertainty still seems to be the order of the day.

However, the Bitcoin price seems to be leaning more toward a bearish setup, as suggested by the negative shift of a relevant technical indicator on a longer timeframe. Below is what happened to the price of BTC the last four times this indicator flipped bearish.

BTC Price At Risk Of 70% Correction: Analyst

In an October 24 post on the social media platform X, crypto analyst Ali Martinez put forward a bearish outlook for the price of Bitcoin. The online pundit revealed that the market leader might have returned to a familiar position that has often led to significant losses (approximately 70%) in the past.

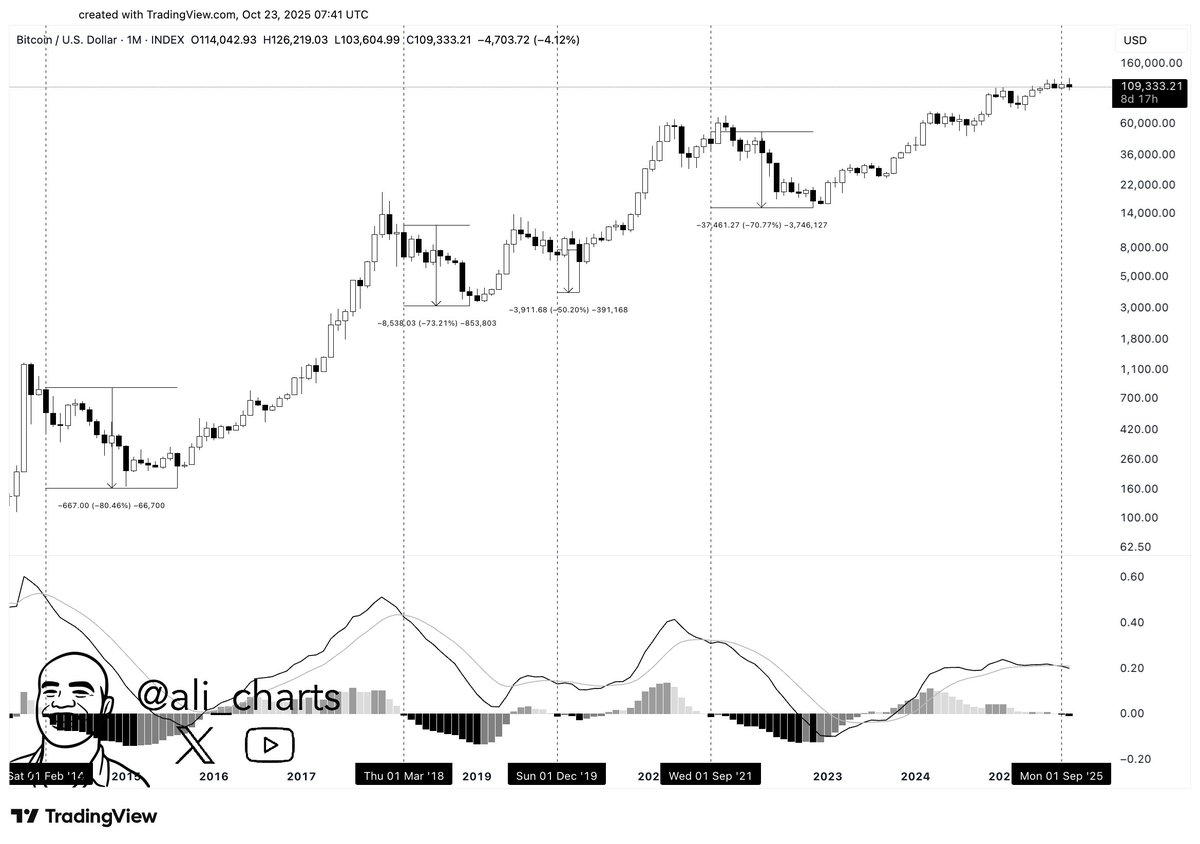
This bearish prediction is based on the changes in the Moving Average Convergence/Divergence (MACD) indicator, which shows the relationship between moving averages of an asset’s price (the Bitcoin price, in this context). Typically, a cross of the MACD line above the signal line is a bullish sign for the asset’s price.

Meanwhile, when the MACD line crosses beneath the signal line, it indicates that the asset might be taking a bearish structure. As seen in the highlighted chart, the Bitcoin MACD line just crossed below the signal line on the monthly timeframe, which means that the flagship cryptocurrency could be gearing up for an extended period of downward price movement.
Bitcoin price

What’s more striking is the historical performance of the Bitcoin price whenever this MACD crossover occurs. According to Martinez, the price of BTC has seen an average drop of 70% in the last four occasions this indicator flipped to negative.

The last time the Moving Average Convergence/Divergence indicator turned bearish was in September 2021, starting the eventual descent of the market leader to around $16,000 mark in November 2022. As shown in the chart, the Bitcoin price fell by more than 70% in this period.

If history is to go by, this means that the price of BTC is at risk of a 70% decline over the next few months, putting the target at around $33,000 from the current price point.

Bitcoin Price At A Glance

As of this writing, the price of BTC stands at around $110,540, reflecting no significant change in the past 24 hours.

Bitcoin price


from Bitcoinist.com https://ift.tt/tcfLdJr

Comments

Popular posts from this blog

Coinbase Adds Wormhole To Spot Trading As Solana Infrastructure Tokens Gain Visibility

Coinbase listings still matter, even in a market that likes to pretend every token is already globally accessible. The exchange ’s decision to add Wormhole puts another major infrastructure name in front of a much broader pool of traders. That matters because Wormhole is not just another speculative ticker. It sits inside one of crypto’s most important, and most debated, categories: cross-chain connectivity. For more details, visit the official Coinbase platform. TL;DR Coinbase is adding support for Wormhole’s W token on spot markets. The listing gives a higher-profile venue to a token tied to cross-chain infrastructure. It also keeps Solana ecosystem names in front of mainstream exchange users. Why A Wormhole Listing Is Interesting Bridge and messaging infrastructure often do not get the same retail attention as consumer-facing protocols, but they matter enormously to how liquidity and applications move between ecosystems. Coinbase’s listing helps push t...

Ethereum On Exchanges Crashes To Historic Low Amid Market Volatility, A Bullish Signal For Price?

Ethereum saw a bounce back above the $3,000 price market , with bullish sentiment gaining momentum among investors, especially those on centralized exchanges. Even with the market experiencing sideways movements, the overall supply of ETH on crypto exchanges has fallen sharply, hitting unprecedented levels. Lowest Supply Of Ethereum On Exchanges Recent signals from on-chain metrics indicate that the Ethereum market environment is undergoing a quiet yet significant transformation. This unfolding trend is due to the sharp drop in the supply of ETH available on cryptocurrency exchanges. Related Reading: Ethereum Network Fatigue? Monthly On-Chain Transactions Drops As Activity Slows Down As reported by Coin Bureau on the social media platform X, ETH supply on centralized exchanges has hit levels not seen in years. With more holders choosing long-term storage, staking, and self-custody over keeping their assets available for trade, this significant supply drain indicates a change in i...

Bitcoin Remains Range-Bound As Volatility Declines – Analyst Explains Price Action

Bitcoin has experienced frustrating price action in recent weeks, leaving investors impatient about its short-term direction. The price has been testing crucial supply levels between $98K and $100K, struggling to break out as uncertainty dominates the market. The lack of a clear move has led to speculation about whether BTC is preparing for a breakout or another correction. Adding to the uncertainty, the market was hit by negative news on Friday when crypto exchange Bybit was hacked, resulting in the theft of $1.4 billion in ETH. The incident caused fear and volatility, briefly dragging prices lower. However, Bybit responded quickly to reassure investors, easing some of the initial panic and stabilizing the market. Despite this, Bitcoin continues to consolidate in a tight range. Crypto expert Daan shared an analysis on X, noting that BTC is still ranging while volatility is steadily decreasing. As price compression increases, traders are on high alert for a potential explosive move....