Bitcoin To Rally To $144,000 As Bull Flag Pattern Forms – Analyst

Bitcoin prices are currently hovering above $107,000 following a bullish trading week during which the premier cryptocurrency gained by 4.89%. Interestingly, this recent price rally has translated into a 1.06% gain on the monthly chart suggesting a hinting at a gradual shift in market control back to the bulls after several weeks of descending consolidation.

Notably, renowned market analyst with pseudonym Merlijn The Trader backs this emerging bullish momentum, having identified a bull flag pattern on the Bitcoin daily chart, alongside a positive MACD crossover.

Bull Flag Pattern Signals Strong Upside Potential For Bitcoin

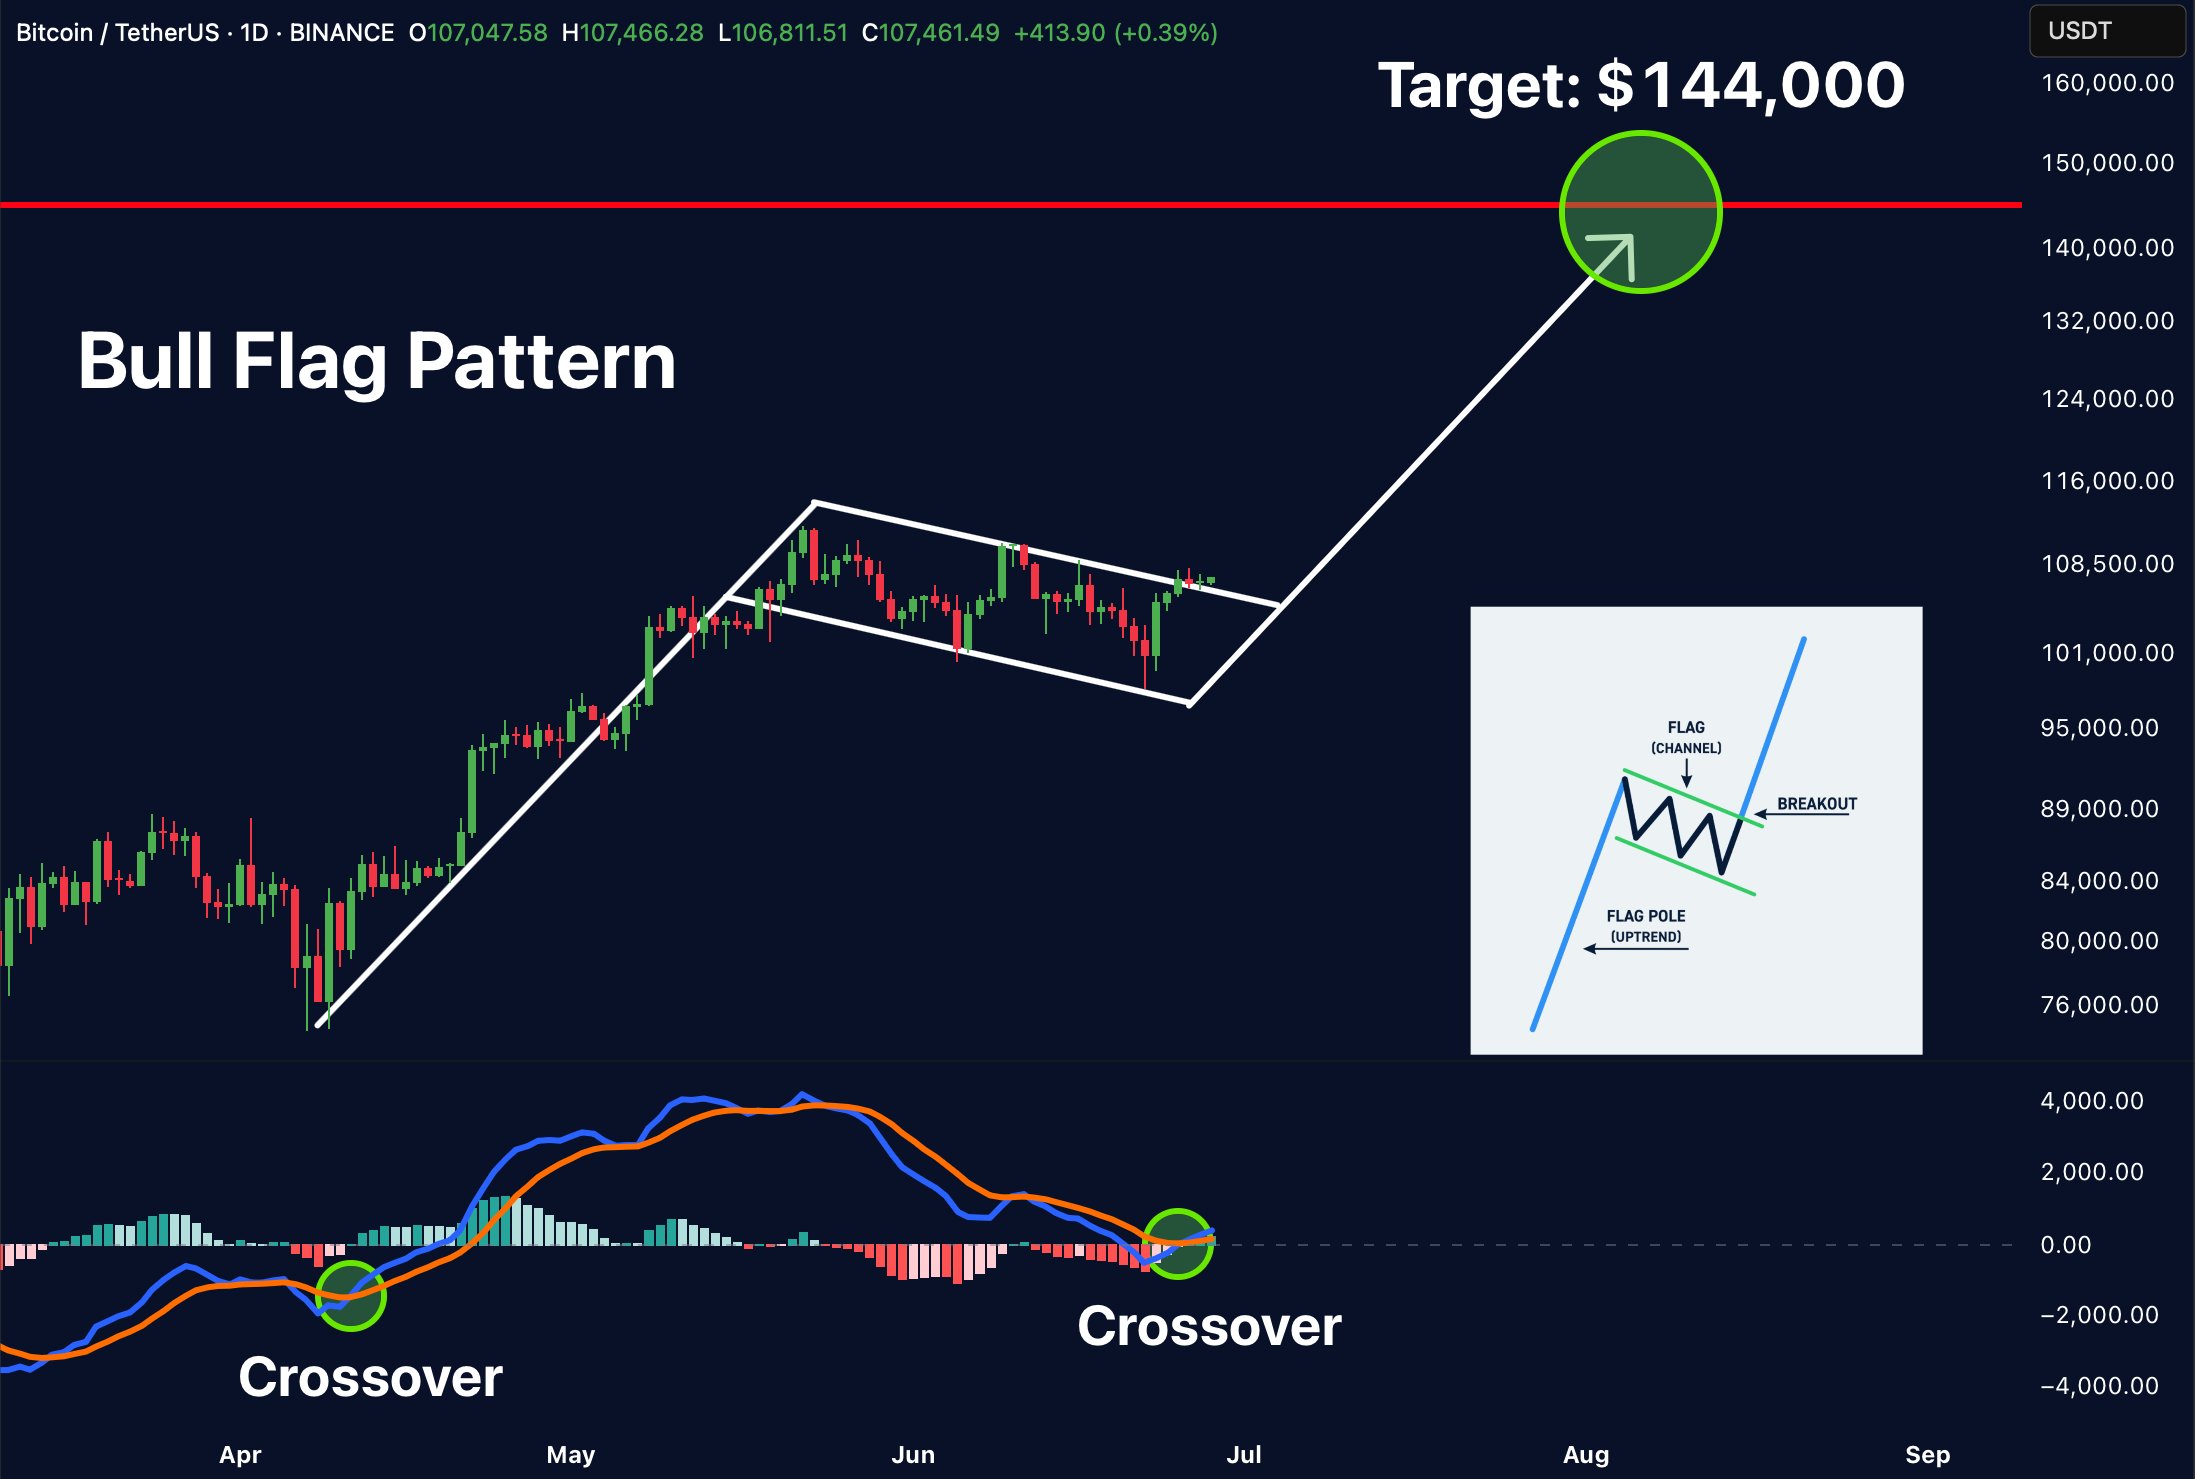
The bull flag is a classic bullish continuation pattern indicating a price rally is likely to persist despite ongoing consolidation. As seen in the chart shared by Merlijn, this bullish chart pattern begins with a sharp price rally i.e. the flagpole which is seen when Bitcoin kickstarted an uptrend in early April with prices climbing aggressively from around $74,000 to over $110,000 in late May. 
Bitcoin

The flagpole is followed by the flag/pennant which is a period of price consolidation that forms a downward or sideways-sloping channel. This price movement is from when Bitcoin reached a new all-time high on May 22 till now with prices largely consolidating within a descending channel between $101,000 – $110,000. The flag is usually interpreted as brief cooling-off period before momentum resumes in the direction of the original trend.

Interestingly, recent candle movement shows a breakout from the bull flag upper boundary indicating the uptrend may soon resume. Based on Merlijn’s analysis, if the breakout is confirmed with a decisive close, the measured move for the new price rally, which is usually similar to the length of the initial flagpole points toward a target of $144,000 i.e. a potential 34% on current market prices.

In supporting this bullish case, the market analyst has also observed a recent crossover on the Moving Average Convergence Divergence (MACD) indicator. Notably, the MACD line (blue) has crossed above the signal line (orange) from below, often interpreted as a buy signal by traders. Interestingly, this marks the first positive crossover in June and comes when Bitcoin tests the upper band of the bull flag.

With both price action and technical indicators hinting at an impending breakout, Merlijn nudges investors to front-run this rally or risk FOMO once the move is fully underway. However, all market participants are advised to do their due diligence before making investment decisions.

Bitcoin Price Overview

At the time of writing, Bitcoin exchanges hands at $107,485 after a minor 0.03% gain in the last day.

Bitcoin

from Bitcoinist.com https://ift.tt/lhSu2Ni

Comments

Popular posts from this blog

Bitcoin ETFs Post Second Straight Week Of $500 Million Outflow — Details

The US-based spot Bitcoin ETFs (exchange-traded funds) recorded their second consecutive week of significant outflows over the last five-day trading period. This recent run of disappointing performances reflects the ongoing shift in investor sentiment in the United States. Over the past year, strong inflows into the US Bitcoin ETF market have constantly been associated with positive action for the BTC price. Fittingly, the price of Bitcoin has been consolidating over the past few weeks, struggling to pick up any real momentum. Bitcoin ETFs Record Fourth Consecutive Outflow Day According to the latest market data , the US Bitcoin ETFs registered a total daily outflow of $62.77 million on Friday, February 21. This latest round of withdrawals marked the fourth straight day (and the eighth day in the last nine trading days) that the crypto-based products would witness a net capital outflow. The Grayscale Bitcoin Trust (with the ticker GBTC) accounted for a larger percentage of Friday’...

Bitcoin Remains Range-Bound As Volatility Declines – Analyst Explains Price Action

Bitcoin has experienced frustrating price action in recent weeks, leaving investors impatient about its short-term direction. The price has been testing crucial supply levels between $98K and $100K, struggling to break out as uncertainty dominates the market. The lack of a clear move has led to speculation about whether BTC is preparing for a breakout or another correction. Adding to the uncertainty, the market was hit by negative news on Friday when crypto exchange Bybit was hacked, resulting in the theft of $1.4 billion in ETH. The incident caused fear and volatility, briefly dragging prices lower. However, Bybit responded quickly to reassure investors, easing some of the initial panic and stabilizing the market. Despite this, Bitcoin continues to consolidate in a tight range. Crypto expert Daan shared an analysis on X, noting that BTC is still ranging while volatility is steadily decreasing. As price compression increases, traders are on high alert for a potential explosive move....

OpenSea Dodges A Bullet As SEC Drops Investigation—Details

In a move that many in the crypto industry view as a positive signal, the US Securities and Exchange Commission (SEC) has officially discontinued its investigation into OpenSea, the leading NFT marketplace. This decision concludes months of uncertainty regarding the regulatory status of NFTs and their classification under US securities laws. SEC Decision Signals A Shift On February 21, 2025, Devin Finzer, the CEO and co-founder of OpenSea, said the SEC will not take any enforcement action against the firm. This comes following the August 2024 Wells Notice to OpenSea issued by the SEC, which indicated the possibility of legal action on alleged unregistered securities offenses. The outcome of this case suggests a possible shift in the way authorities handle NFTs, therefore affecting the whole scene of digital assets. For the industry, this outcome has been seen as a major turning point. Though they are in rivalry with OpenSea, Chris Akhavan, the Chief Business Officer of Magic Eden,...