
Newbie Bitcoin Whales The Ones Taking Profits This Rally, Data Shows

On-chain data shows the Bitcoin short-term holder whales have been taking significantly more profits than the diamond hands in this rally.

New Bitcoin Whales Are Participating In Notable Profit-Taking

In a new post on X, CryptoQuant author Axel Adler Jr. discussed how profit-taking has recently looked from the two major Bitcoin whale cohorts: the short-term holder and long-term holder whales. The short-term holders (STHs) and long-term holders (LTHs) are two broad divisions of the BTC network done on the basis of holding time, with the cutoff between them being 155 days.

Similarly, ‘whales‘ are also a classification of the asset’s investors, but in this case, the criterion is holding balance. More particularly, whales are defined as holders with more than 1,000 BTC. As such, the STH and LTH whales would refer to the big-money members of the STH and LTH groups, respectively.

Now, here is the chart shared by the analyst that shows the trend in the total amount of profit realized by these groups during the past few months:

Bitcoin Realized Profit

As displayed in the above graph, both of the groups have participated in some degree of profit-taking recently. Still, clearly, the new whales who got into the market in the past five months have been the ones making up for the majority of this selling. This trend is different from how it was in January, when the profit realization was more balanced across these cohorts.

Historically, the STHs have tended to be reactive to market events, while the LTHs have shown resilience. So, the whales falling to the temptation of profit realization in the recent rally may not be too surprising. That said, so far, the profit-selling in the market hasn’t yet reached the same highs as in January.

The whales represent a broad group that can be divided further into the regular-sized whales (1,000 to 10,000 BTC) and ‘mega’ whales (10,000+ BTC). According to data from the on-chain analytics firm Glassnode, the two groups haven’t been showing consistent behavior recently.

Bitcoin Accumulation Trend Score

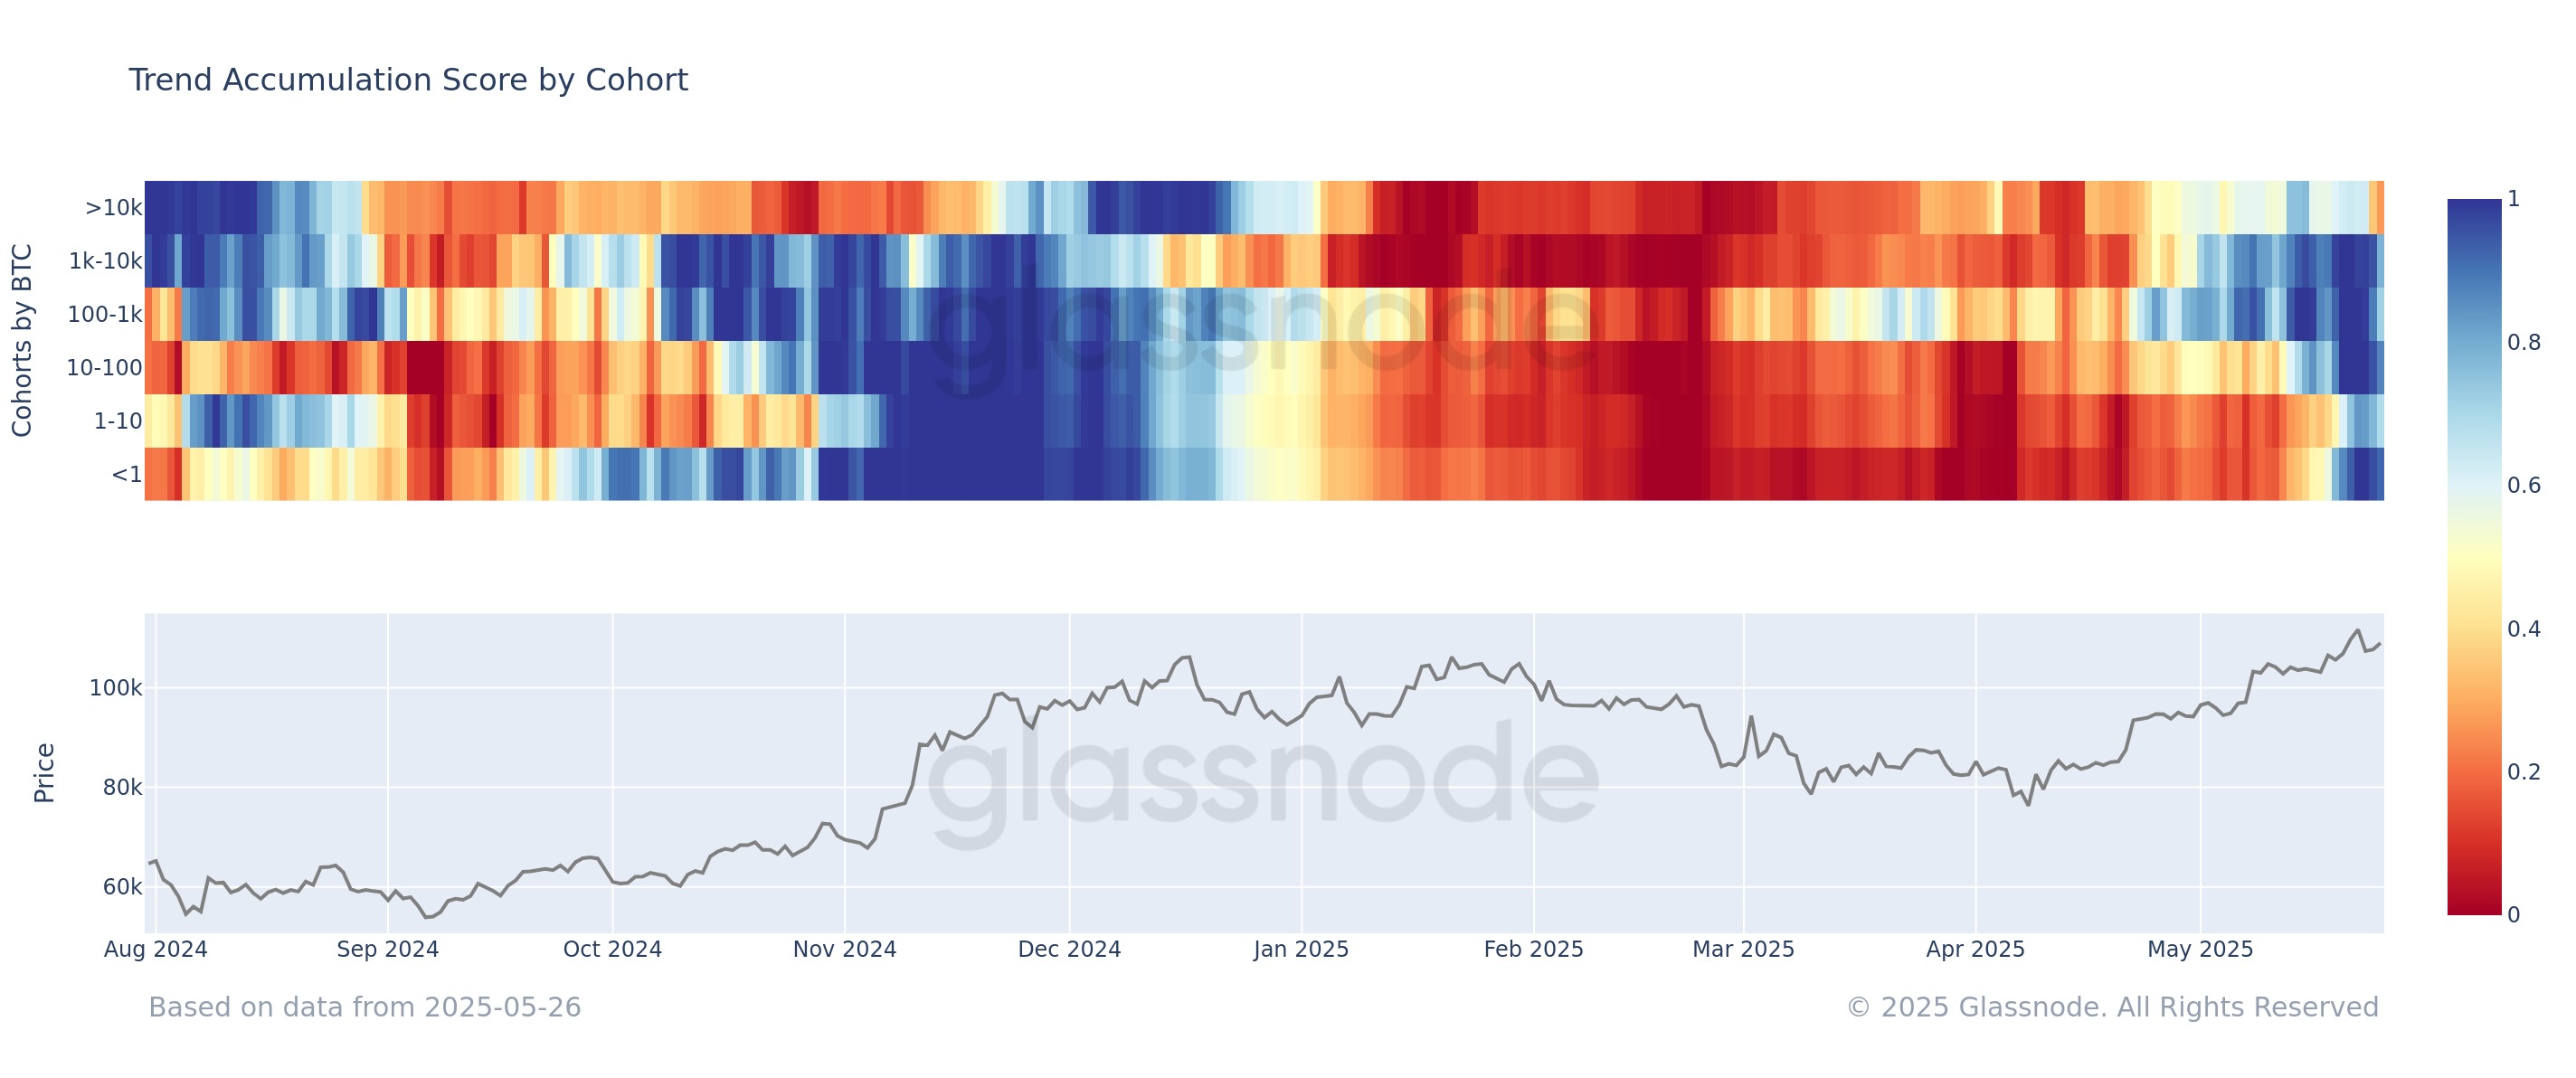
As is visible in the above chart, the Bitcoin Accumulation Trend Score, an indicator that tells us about whether the investors are accumulating or distributing their coins, has been close to 1 for the whales recently, a sign that these large entities have been displaying strong accumulation.

The smaller cohorts have also been displaying a similar behavior, but the mega whales have diverged from the rest as they have taken to distribution instead.

BTC Price

At the time of writing, Bitcoin is floating around $109,800, up around 6% in the last seven days.

Bitcoin Price Chart


from Bitcoinist.com https://ift.tt/MkrTcIq

Comments

Popular posts from this blog

Bitcoin Remains Range-Bound As Volatility Declines – Analyst Explains Price Action

Bitcoin has experienced frustrating price action in recent weeks, leaving investors impatient about its short-term direction. The price has been testing crucial supply levels between $98K and $100K, struggling to break out as uncertainty dominates the market. The lack of a clear move has led to speculation about whether BTC is preparing for a breakout or another correction. Adding to the uncertainty, the market was hit by negative news on Friday when crypto exchange Bybit was hacked, resulting in the theft of $1.4 billion in ETH. The incident caused fear and volatility, briefly dragging prices lower. However, Bybit responded quickly to reassure investors, easing some of the initial panic and stabilizing the market. Despite this, Bitcoin continues to consolidate in a tight range. Crypto expert Daan shared an analysis on X, noting that BTC is still ranging while volatility is steadily decreasing. As price compression increases, traders are on high alert for a potential explosive move....

Ethereum On Exchanges Crashes To Historic Low Amid Market Volatility, A Bullish Signal For Price?

Ethereum saw a bounce back above the $3,000 price market , with bullish sentiment gaining momentum among investors, especially those on centralized exchanges. Even with the market experiencing sideways movements, the overall supply of ETH on crypto exchanges has fallen sharply, hitting unprecedented levels. Lowest Supply Of Ethereum On Exchanges Recent signals from on-chain metrics indicate that the Ethereum market environment is undergoing a quiet yet significant transformation. This unfolding trend is due to the sharp drop in the supply of ETH available on cryptocurrency exchanges. Related Reading: Ethereum Network Fatigue? Monthly On-Chain Transactions Drops As Activity Slows Down As reported by Coin Bureau on the social media platform X, ETH supply on centralized exchanges has hit levels not seen in years. With more holders choosing long-term storage, staking, and self-custody over keeping their assets available for trade, this significant supply drain indicates a change in i...

Past Performances Say Dogecoin Price Could Blast 200% To Clear $0.73 ATH Soon

The Dogecoin price could be getting ready for a fresh bullish wave as a crypto analyst projects a surge to new all-time highs . The analyst cites past performances as a reason for this bullish projection, highlighting the Dogecoin price action from previous bull cycles.  Dogecoin Price Past Performance To Push It Above $0.73 Crypto analyst Javon Marks took to X (formerly Twitter) on February 22 to share a bullish prediction of the Dogecoin price. The analyst highlighted past bull market performances to support his forecast, predicting that DOGE could soon rally above its current all-time high of $0.73905. In his chart, Marks revealed Dogecoin’s price action during the 2016/2017 bull run and the 2020/2021 bull market. In both cycles, DOGE seemingly experienced a rapid price crash, following a descending price channel . However, after a long period of consolidation, it recorded a massive price rally that triggered an ATH breakout to $0.00232 in 2018. During the 2021 bull marke...